 AI-generated image
A reader recently got in touch with us, frustrated and surprised about this fact: Between April 8 and April 11, the Nasdaq-100 index in the US surged from 17,090 to 18,690—a gain of 9.36 per cent. But during the same period, Motilal Oswal Nasdaq 100 ETF, which tracks this index, rose only 1.7 per cent on the Indian stock exchange — from Rs 164 to Rs 167. Even after accounting for a mild rupee depreciation, the returns appeared significantly lower than expected.
So, what explains the gap, the reader pointedly asked us?
The reason is the difference between an ETF's market price and its net asset value (NAV).
Why the difference between NAV and market price?
You can't blame the NAV, which reflects the actual value of the ETF's underlying holdings. It tracked the Nasdaq accurately, rising from Rs 1,439.84 to Rs 1,571.70 during the same period, delivering a 9.16 per cent return, broadly in line with the Nasdaq's own movement.
However, what investors saw on the stock exchange was the market price, which doesn't always reflect the NAV in real time.
That's because ETFs, unlike other mutual funds, trade on stock exchanges like regular stocks. And like stocks, an ETF's market price is influenced by:
a) trading activity
b) investor sentiment
c) liquidity.
So, when the demand for an ETF is high, so is its market price - and vice versa. As a result, ETFs can sometimes trade at a premium or discount to their NAV.
Such deviations between NAV and market price can be more visible in international ETFs, especially at this point of time, where only a limited number of international mutual funds are accepting fresh investments.
How to avoid buying ETFs at a high market price?
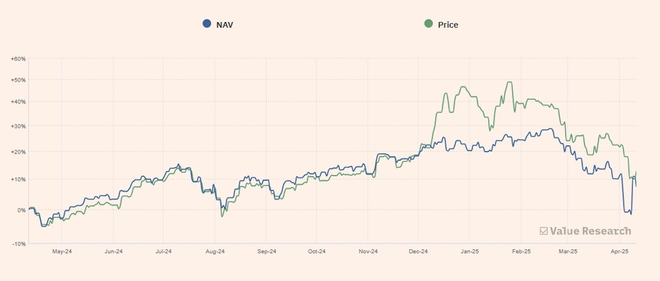
You can check the divergence between the NAV and the market price easily on the Value Research fund page for any ETF. The 'NAV vs Price' chart shows the percentage returns of both over time. A visible gap between the two lines suggests that the ETF may have been trading at a premium or discount during certain periods.
In the one-year return chart of the Motilal Oswal Nasdaq 100 ETF, you can see periods where the market price (green line) was above or below the NAV (blue line), offering a helpful visual cue.
This is why, when investing in ETFs — especially international ones — it's important to go beyond just the traded price. Always check the NAV and assess whether the fund is trading close to its fair value.
Buying at a significant premium means you're paying more than the ETF's actual worth — and if that premium narrows later, your returns could suffer even if the underlying index performs well.
Because in the case of ETFs, what you see on the screen may not tell the full story.
Also read: 3 reasons debt funds aren't just for retired & boring people
Disclaimer: This content is for information only and should not be considered investment advice or a recommendation.
For grievances: [email protected]
Ask Value Research ![]()