IPOs are not an avenue for quick bucks anymore. More than 60 per cent of the issues that hit the primary market in the last five years are still in the negative territory. The number of issues in the primary market has dropped significantly in the recent past as most promoters have become wary of tapping the market due to its dismal performance. Tougher IPO norms introduced by the Sebi also had an adverse impact on the market.
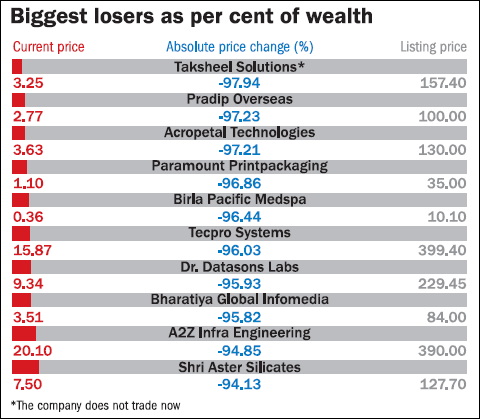
The period of 2010-2012, three succeeding years after the financial crisis, turned out to be a dark period for IPO investors. This period has witnessed as many as 116 IPOs and 70 per cent of them lost around 50 per cent of their market value. Some of these companies were later embroiled in various scams and the Sebi has debarred them from further fund-raising activities. And four of these companies do not trade on the bourses anymore.
The calender year 2013 witnessed the lowest fund raising through IPOs, excluding the IPOs on the SME platform. Only three companies raised ₹1,069 crore in CY2013, the lowest in the last decade. Interestingly, all the three companies have given over 100 per cent absolute returns to investors. CY2014 was a little better. Five companies have raised ₹1,213 crore from the primary market.
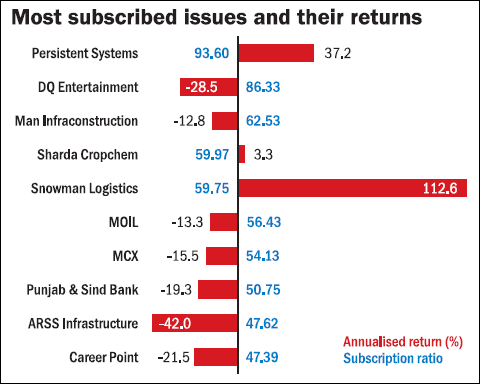
Most hyped IPOs have become the biggest laggards. Seven companies out of the top 10 oversubscribed issues have given negative returns. Also, companies which gained the most on the listing day, another symbol of hype, have failed to live up to the promise. Seven companies out of the top 10 gainers on the listing day are in the negative zone even now.
Biggest gainers
| Company name | Issue price (₹) | Listing month | Adj listing price (₹) | Current price (₹) | Annualised return (%) |
| Wonderla Holidays | 04/05/1900 | 41760 | 165 | 320 | 165.5 |
| Repco Home Finance | 20/06/1900 | 41365 | 165 | 683 | 121.8 |
| NBCC | 10/04/1900 | 41000 | 100 | 822 | 114.9 |
| Snowman Logistics | 15/02/1900 | 41883 | 75 | 97 | 112.6 |
| Just Dial | 13/06/1901 | 41426 | 590 | 1472 | 76.7 |
| Gallantt Ispat | 18/02/1900 | 40452 | 49 | 400 | 63.8 |
| V-Mart Retail | 28/07/1900 | 41306 | 216 | 521 | 59.3 |
| Jubilant FoodWorks | 24/05/1900 | 40210 | 162 | 1414 | 55.3 |
| Tree House Education | 08/05/1900 | 40756 | 133 | 442 | 42.6 |
| Persistent Systems | 05/11/1900 | 40269 | 400 | 1807 | 37.2 |
Biggest losers in terms of market capitalisation
| Company name | Issue price (₹) | Listing month | Listing market cap (₹cr) | Current market cap (₹cr) | Loss in market cap (₹cr) |
| Electrosteel Steels | 11 | 01/10/2010 | 2289 | 1026 | -1263 |
| Ramky Infrastructure | 450 | 01/10/2010 | 2216 | 272 | -1943 |
| Tecpro Systems | 355 | 01/10/2010 | 2059 | 80 | -1978 |
| MCX | 1032 | 01/03/2012 | 6615 | 4385 | -2229 |
| MCX | 400 | 01/12/2010 | 2440 | 174 | -2266 |
| SKS Microfinance | 985 | 01/08/2010 | 7835 | 5566 | -2269 |
| MOIL | 375 | 01/12/2010 | 7837 | 5161 | -2676 |
| Engineers India | 290 | 01/08/2010 | 10821 | 7606 | -3214 |
| DB Realty | 468 | 01/02/2010 | 11078 | 1626 | -9452 |
| Jaypee Infratech | 102 | 01/05/2010 | 12681 | 2986 | -9695 |
Sizes and number of IPOs since 2010
| Calender year | Sum of issue sizes (` cr) | No. of IPO issues | ||
| 2010 | 44332 | 67 | ||
| 2011 | 6149 | 38 | ||
| 2012 | 6668 | 11 | ||
| 2013 | 1069 | 3 | ||
| 2014 | 1213 | 5 | ||
| Total | 59431 | 124 | ||