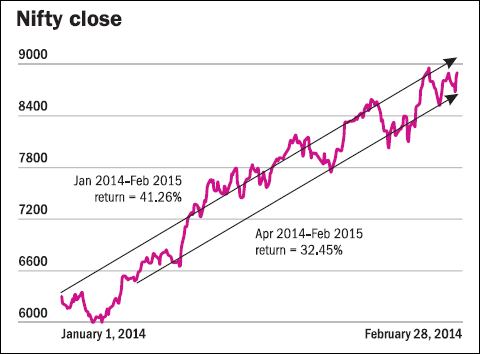
In the past year-plus (January 2014 -February 2015), the Nifty has given a return of roughly 41 per cent. It was at around 6,300 in early January 2014, and it closed at around 8,900 on February 28. Let's assume that an investor is looking at various ways to try and maximise returns from this bull run.
A passive buy-and-hold position taken in early January 2014 in an index fund or ETF would pick up about 41 per cent. An SIP across those 14 months would have yielded an average (not annualised) return of 21 per cent for the entire corpus.
If we look at the fiscal year (April 2014-Feb 2015), then the eleven-month return is about 32 per cent, with the SIP returning an averaged 15 per cent across this period. The NDA government took charge in mid-May. The return since the election results is about 33 per cent.
In practical terms, an investor may wonder how to receive a high proportion of this theoretical index return without taking excessive risks or spending much time. There are several ways in which investors or traders could reasonably deploy corpus. A discussion of the pros and cons of different methods may be useful.
Returns month by month
| Month | Return# | Month | Return# |
| 01/01/2014 | 41.26 | 01/08/2014 | 17.09 |
| 01/02/2014 | 48.32 | 01/09/2014 | 10.89 |
| 01/03/2014 | 43.08 | 01/10/2014 | 12.04 |
| 01/04/2014 | 32.45 | 01/11/2014 | 6.94 |
| 01/05/2014 | 32.97 | 01/12/2014 | 4.04 |
| 01/06/2014 | 20.91 | 01/01/2015 | 7.46 |
| 01/07/2014 12:00:00 AM | |||
A passive buy-and-hold investor who only invests large lump sums once in a while is taking a big risk. He may be buying at a temporary market peak, for example. Also, if he is accumulating savings over a long period in order to invest the lump sums every so often, where does he park those savings in between equity investments? That is a big practical problem with the 'bullet method' of making occasional big investments.
In a smooth uptrend, we would expect the return, month by month, to decline steadily as the time period gets shorter. But equity returns are always somewhat volatile. A lump sum invested in February 2014 actually returns more than the same invested in January 2014. In annualised terms, January 2015 gives better returns than February 2015.
Apart from lump sum buy and hold, we must consider the returns that an SIP investor will receive. In effect, since the SIP is being averaged across every month, the varying volatility will even out over time. There will be times when the SIP is invested at a high price and yields less. There will also be times when the SIP is made after a market correction and yields more.
SIP and buy & hold returns
| Period | Return (%) |
| B&H 14 months | 41.26 |
| B&H 11 months | 32.45 |
| SIP 14 months | 21.09 |
| SIP 11 months | 14.78 |
As we know, this is a tried-and-tested method of ensuring stock market exposure with a decent return. The real advantage of an SIP is most apparent over the long term (when the SIP is held for several years or more) because the method ensures that investors buy at market bottoms as well as at tops. During a period like 2014-15, when the market was in a clear uptrend, the SIP just ensures that the investor continues to participate whatever happens.
There are other possible methods that could yield better returns. But the risks may rise. For example, traders would use a classic trend-following trading system. Most such systems are designed to give buy and sell signals with time periods depending on the trader's preferences.
For example, the system might give a trading 'buy signal' when the market climbs to a twenty-day or 55-day high, or when the market moves above a given moving average (typically, a moving average might be 21-day or 10-day or 200-day).
Trend-following trading systems also use trailing stop losses. For example, a stop might be set initially at, say, 2 per cent below the entry price. If the position moves into profit, the trailing stop loss will be hiked. There are key subjective systemic decisions to be made. When is an initial stop loss set? When is it reviewed and hiked? If the trader is using Nifty futures (rather than a Nifty ETF), he also gets the benefits and risks of leverage. Every profit and every loss is amplified by a ratio of about six.
Given a 'perfect' trading system, the trader will enter at every market bottom and book profits at every market peak. Therefore, in theory he could make a higher return.

The dream chart indicates that the trader would take at least four long trades. (Most traders would also have shorted on the corrections). Perfectly managed, these four long trades might have yielded returns of 65 per cent (not annualised).

However, perfection is easier dreamt of than attained. There are no guarantees that a trend following system will pick up all the peaks and bottoms. Also, there are two significant cost escalations, when trading methods are compared to SIPs. First, the trader must carry over positions across settlements. This means high brokerages and relatively frequent trades. Second, every time a profit is booked, there is tax payable. When both these effects are taken into account, it requires fantastic luck and trading skills to beat the SIP return.
It was not a smooth uptrend. The corrections were significant. There were multiple successive peaks and troughs with each set running higher.
There is another way in which a sensible investor could try and pick up the basic SIP return while also trying to exploit extra volatility without taking on excessive risk. This is by using the options trading system designed to pick up high volatility.
Options traders can just play to take on volatility. Let's say, a 'big move' is defined as a 5 per cent swing in either direction away from the closing price of the first day of a new settlement.
A trader might take a long strangle consisting of a long call and a long put, each with strike prices set at around 5 per cent from the index level. The options trader hopes that one of these options will be struck during the settlement. If the index moves 5 per cent in either direction, this will happen.
In practice, an option at about 5 per cent from the prevailing price would cost roughly 0.5 per cent of the strike price on the first day of a settlement. That is, taken together, these two options work out to about 1 per cent of the prevailing index value.
If the Nifty does move enough to strike one of the options, the returns will be anywhere from about 2 per cent to 10-15 per cent or more. The exact return would depend on the extent of the move and the time to expiry when the strangle was struck. We can assume a 2:1 return ratio every time the index moves over 5 per cent and one of these options is struck. Therefore, the strategy breaks even if volatility hits 5 per cent or more once in every two months.
In reality, the Nifty moved more than 5 per cent in 11 out of those last 14 months. In effect, the strangle return across this period has been close to 25:1, which is incredible. More generally, such a wide strangle may work during any period of high volatility.
The famous trader Nassim Nicholas Taleb has made his money and reputation by using this sort of strategy. The details of such a system are tricky. What is the ideal distance from money? Should long options be taken at 5 per cent or 7.5 per cent or 10 per cent of the distance? The greater the distance, the lower the probability of the position being hit. But the more the returns if it works.
Settlement volatility
| Settlement month | High | Low | First day index | Volatility (%) | Strangle return (%) |
| 01/01/2014 | 6358.3 | 6027.25 | 6301.65 | 5.25 | 50 |
| 01/02/2014 | 6245.95 | 5933.3 | 6089.5 | 5.13 | 50 |
| 01/03/2014 | 6673.95 | 6212.25 | 6276.95 | 7.36 | 250 |
| 01/04/2014 | 6861.6 | 6643.8 | 6695.9 | 3.25 | -100 |
| 01/05/2014 | 7563.5 | 6638.55 | 6782.75 | 13.64 | 850 |
| 01/06/2014 | 7700.05 | 7118.45 | 7229.95 | 8.04 | 350 |
| 01/07/2014 | 7840.95 | 7422.15 | 7508.8 | 5.58 | 100 |
| 01/08/2014 | 7968.25 | 7540.1 | 7602.6 | 5.63 | 100 |
| 01/09/2014 | 8180.2 | 7877.35 | 8027.7 | 3.77 | -100 |
| 01/10/2014 | 8181.55 | 7723.85 | 7968.85 | 5.74 | 50 |
| 01/11/2014 | 8535.35 | 8198.05 | 8322.2 | 4.05 | -100 |
| 01/12/2014 | 8626.95 | 7961.35 | 8588.25 | 7.75 | 250 |
| 01/01/2015 | 8985.05 | 8065.45 | 8200.7 | 11.21 | 650 |
| 01/02/2015 | 8996.6 | 8470.5 | 8808.9 | 5.97 | 150 |
| Total ret (%) | 2550 |
Also, what is the hedge ratio? If the investor buys one lot of strangles (one call + one put) for every Nifty lot in his SIP, he is potentially sacrificing 1 per cent of return every month. That is significant. If volatility eases off, it will impact returns adversely. But if volatility stays at these levels, the strangle will add a lot to overall returns. It will also provide a hedge in months of deep corrections.
The market is trading quite close to its all-time record levels. It could go up, down, or sideways but volatility is likely to remain high. It seems worth considering a wide strangle strategy of this nature.
The writer is an independent financial analyst.
