Corporate results in July-September 2015 were rather disappointing. Across a sample of 1,600 odd companies (with a cut-off minimum sales of ₹10 crore), total sales fell by 4.8 per cent. Looking a little deeper, raw material costs fell by 23 per cent and the cost of purchased goods fell by 10 per cent. Interest outgo increased by 5.7 per cent. Net profits dropped by 2 per cent and PBDIT was up by 1.9 per cent.
The easiest and most popular way to judge trends in a particular variable is to compare the latest values to the values taken a year ago (sometimes a quarter ago). But if the initial base value is unusually high or low, that year-on-year change may be somewhat misleading. Due to the potential for distortion time-series variables such as inflation indices, index of industrial production, exports, imports, etc., must all be treated with caution.
For example, take a look at crude prices over the past couple of years. The international price of oil was around $45/barrel of Brent-grade crude by November 2015, down from over $100/barrel in early 2014. So, the trend has very clearly been negative.
But the base effect overstates the downtrend. Crude prices started falling in September 2014, towards the end of the July-September quarter. In July 2014, Brent was trading at around $110/barrel and it traded at around $95 in late September. So, the prices were pretty high through that period, averaging about $102.
In the corresponding quarter of July-September 2015, prices averaged around $50.45. A pure YoY comparison would suggest that crude was trending steeply down due to the base effect. As the price chart indicates however, crude prices have actually range-traded and moved more or less sideways since January 2015, when they seemed to have hit some sort of bottom in the range of $40-45.
The base effect also complicates the way another key economic variable, inflation, looks when comparing those two quarters. Take a look at the chart of the Wholesale Price Index (WPI).
The WPI started falling in the July-September quarter 2014 precisely because oil and other commodities started to drop in price. It has actually moved up somewhat since February 2015 while staying well below 2014 levels. Between July and September 2014, the WPI fell from 177.6 to 176.6.
Now look at the YoY change of the WPI and you get a different impression. The WPI change has been in the negative territory for all of calendar year 2015. However, if we look at July-September 2015, it appears as though the trend is bouncing off a low, although it remains well in the negative territory. This is probably overstating deflationary tendencies. We are likely to see a base effect operating in the opposite direction soon. By January 2015, crude was bottoming out. It is very likely that inverse base effects will be visible in January 2016.
The RBI (which tracks the Consumer Price Index rather than the WPI) has cut the policy rate several times, by about 1.25 per cent. Between July-September 2014 and July-September 2015, the policy rate dropped by 0.75 per cent. That was not fully transmitted by the commercial banking system but interest rates did come down across the board.
There is also a currency factor that is worth bearing in mind. Between July and September 2014, the rupee ranged between 59.72 and 61.62 versus the USD, with an average value of 60.59. In July-September 2015, it averaged about ₹64.9, with a maximum-minimum range of 63.37 to 66.74. So, there was a significant currency depreciation of about 7 per cent.
Now take a look at the aggregated corporate results again. Sales fell overall by 4.8 per cent. This is partially explained by falling inflation, though it suggests a lack of demand. Raw material expenses and cost of finished goods fell by 23 per cent and 10 per cent, respectively - again, at least partially explained by falling inflation. The base effect will be less pronounced when October-December 2015 (the current quarter) is compared to October-December 2014 because the differences between crude prices, inflation, etc., are less pronounced. Cost differentials are likely to be smaller in the next quarter.
Rising interest costs are a cause of serious concern in the circumstances. If sales have not risen and interest rates have fallen, why should interest costs have risen? Investment has not risen much; bank credit is up by only 6.9 per cent, which is among the lowest levels seen in the last 20 years. The interest burden going up in these circumstances is probably a sign of higher working capital costs. That is a bad signal indeed.
The fall in crude prices was matched by similar falls in the prices of gas and coal. Imported coal and spot cargoes of LNG became cheaper. Coal despatches from Coal India also improved. This had interesting impacts on the energy sector.
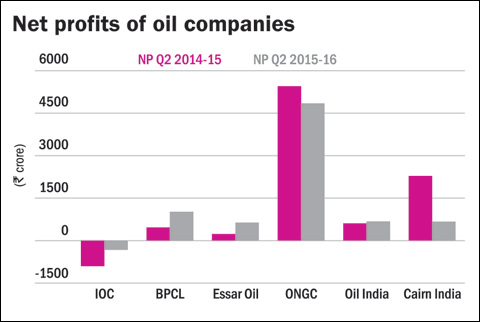
Refineries and marketers did better through the quarter as their costs dropped. IOC reduced losses, while BPCL and Essar Oil saw expanding profits. Crude-oil producers saw reduced profits on the other hand (see the graph below).
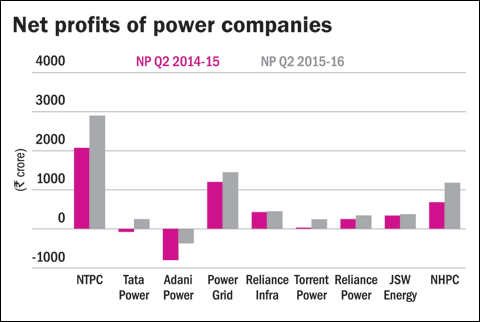
The power generation sector was a major beneficiary of lower fuel costs and better supply. Every major company seems to have benefited from turnarounds in several cases (see the graph below).
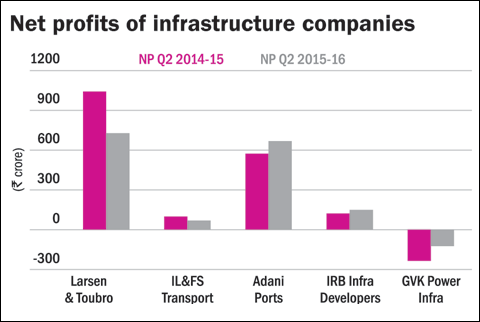
At the same time, the infrastructure sector appeared to be in a bad shape. The companies in the sector showed signs of declining profits and are also struggling with higher interest costs. More deleveraging is required.
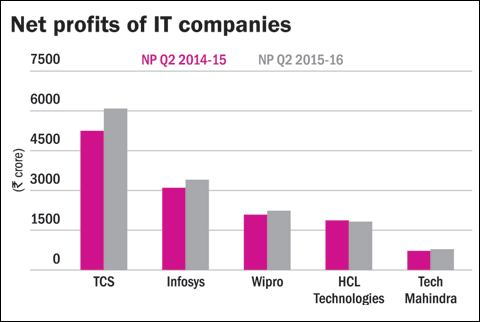
The IT industry did reasonably well on the surface. The top five generated over 80 per cent of the industry turnover and saw 10 per cent rise in net profits and 14 per cent rise in turnover in rupee terms. Once you factor in the changes in the exchange rate, with the rupee falling 7 per cent, the performance is much less impressive.
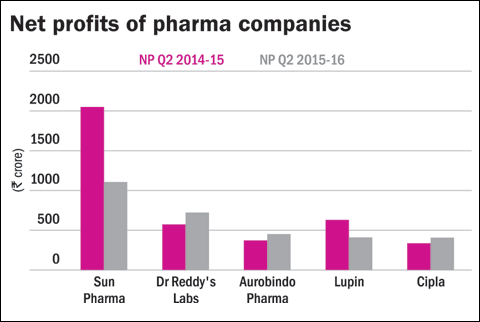
The pharma industry is another key exporter, so rupee depreciation has some bearing. It is facing regulatory issues with the US Food and Drugs Administration giving negative reports on many export facilities. Pharma also has issues of consolidation and litigations regarding intellectual property.
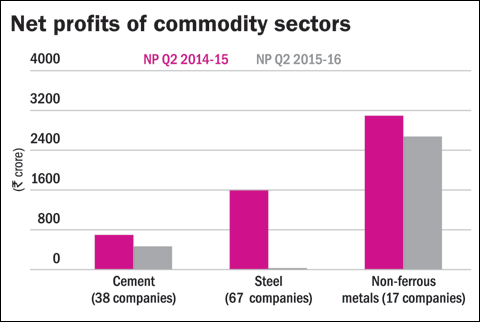
The picture in the commodity sector reflects the sharp drop in prices as well as the drop in demand. Steel, cement and non-ferrous metals - all saw seriously reduced profits. The base effect might be exaggerating the negative impact. We won't know till the next quarter.
Overall, there are serious issues in terms of demand and several sectors are finding it hard to cope with a difficult environment. But we will not be able to assess the situation clearly until the base effect eases off.
The writer is an independent financial analyst.
This column appeared in the December 2015 Issue of Wealth Insight.
