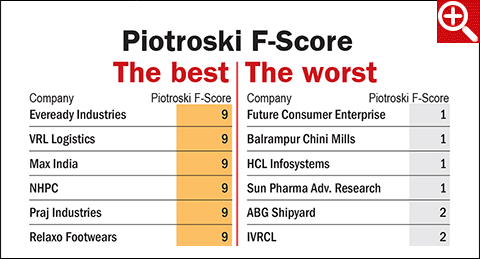
The Piotroski F-Score was devised by Joseph Piotroski, a professor of accounting at the University of Chicago. Piotroski believed that financial strength could be determined by using data solely from financial statements. The methodology was first published in 2000. A company is rated on a scale of zero to nine, nine being the best. A score of eight or nine is considered strong. A score of two or less is weak. Since the score is based on recent performance, we can say it filters out the 'current' outperformer in terms of profitability and financial improvement over the past performance.
Here are the parameters of Piotroski's F-Score.
-
Profitability indicators
- Positive net income in the current year
- Positive operating cash flow in the current year
- Higher return on assets (ROA) in the current period compared to the ROA in the previous year
- Cash flow from operations greater than net income.
-
Balance-sheet health
- A lower long-term debt-to-equity ratio in the current period as compared to that in the previous year
- A higher current ratio this year as compared to that in the previous year
- No new shares issued in the last year
-
Measures for operating efficiency
- Higher gross margin compared to that in the previous year
- A higher asset-turnover ratio compared to that in the previous year
An important point to remember here is that the F-Score compares current financial performance to previous year's. Any company that slows down, however, financially sound, can therefore have a low F-Score. That is why TCS, Wipro, Divi's, Sun Pharma trail with their F-Scores.
There is documented evidence that picking stocks with the F-Score will take you ahead of the markets. Piotroski observed that a portfolio constructed using this strategy gave an average annual return of 23 per cent over a 20-year period from 1976 to 1996 (picking only those stocks with an F-Score of eight or nine), far ahead of the average S&P 500 index return of 15.83 per cent over the same period.
Hunting for value
After applying the F-Score, we decided to look for value in these high-quality stocks. Therefore, we took in only those names that were trading at a maximum of 1.5 times their five-year median P/Es. With this, we demanded a minimum earnings yield of 3 per cent. After removing low-liquidity names, we were left with the names that you can see at the beginning of this story. These are our handpicked stocks for 2016.

