
Economists follow many sets of data. Some of those may seem irrelevant to the layperson. For example, you could live out a comfortable life without knowing anything about the money supply or foreign exchange rates. But some indicators have an obvious impact on daily life. These are considered politically sensitive for that very reason. One such typical indicator is inflation. Everyone understands mehngai. Fear of inflation drives much political policy. Another politically sensitive indicator is employment. Everybody has an instinctive understanding of how employment affects the economy and society.
Inflation and employment also affect each other. High employment is desirable. Low inflation is desirable. But high employment can lead to high inflation. This is for two reasons. First, everybody has money in their pockets, so demand for goods and services is high. At the same time, since everybody is employed, there is less slack capacity to meet demand. So prices rise. Therefore, policy makers have to find ways of balancing them to maximise employment and minimise inflation. Obviously, they need reliable data to make effective policy. Sadly, those data are lacking. Inflation data have improved somewhat, even though there are some major problems. Employment data are a black hole.
India uses two inflation-tracking indices. The Wholesale Price Index (WPI) tracks the prices of manufactured goods at the factory gate. It also tries to use the wholesale prices for agricultural and non-agricultural commodities and mined products. This is quite complicated. Agri products are sold at different wholesale rates in different wholesale markets. The farmer sells at a wholesale rate at the farm gate. That produce is then sold on again, at both urban and rural wholesale markets. Tricky adjustments must be made for seasonality, etc. Further complications arise due to government subsidies, which cause retail prices (as charged by the government) to be lower than wholesale prices (paid by the government to procure food).
The WPI has the following weights. About 20 per cent weight is for 'primary articles', including some food items, cotton, jute, minerals, etc. Just under 15 per cent weight is for fuels, including electricity. The largest basket, with a weight of almost 65 per cent, is manufactured goods. Changes in the WPI may not immediately affect individuals but retail prices 'should' move in the same direction as wholesale.
The Consumer Price Index (CPI), the second inflation index, measures the impact of inflation at the retail level. The weights of the CPI are roughly as follows: 46 per cent weight given to food, 6.5 per cent to clothing and footwear, 10 per cent to housing, 6.8 per cent to fuel, and 'miscellaneous' (which includes travel, medicare, education, communication, personal hygiene, etc.) receives a weight of 28 per cent.
It's important to note that the price indices don't tell you much about the cost of services. The WPI tells you little or nothing about the prices of services. However, the CPI basket does include many services and service-heavy components, like telecom, travel, medicare, house rentals, insurance, banking, etc.
Sector-by-sector contributions (for 2014-15) to India's GDP can be split up as follows: services 53 per cent, industry 30 per cent and agriculture 17 per cent.
Logically, the CPI will be more accurate than the WPI because it does reflect at least some of the inflation in the largest sector, services. The RBI started using the CPI as its key inflation measure only in 2013-14. Prior to that, the WPI was always used.
The WPI and the CPI generally move in the same direction, but there can be major divergences and in the past couple of years, there have been wide spreads between the changes in the two indices. (See the graphs.)
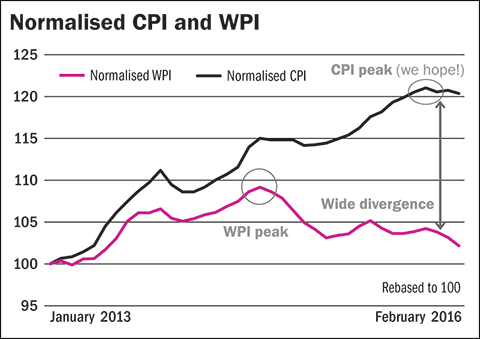
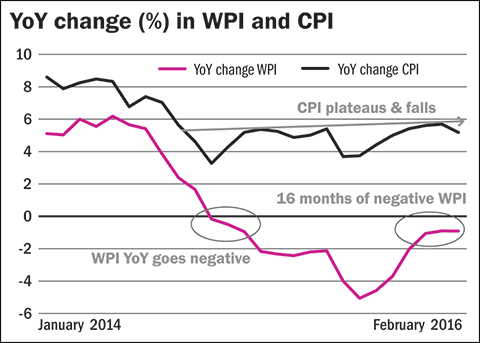
The WPI has been trending negative for 16 months. This has coincided with the fall in international fuel prices. However, while the CPI has trended down, it has not become negative. One reason is that fuel prices have not fallen so much at the retail level. The central government has imposed taxes to mop up revenue, while keeping prices locked at a fairly high level. Another reason is that the food basket has a much higher weight in the CPI and food prices have moved up substantially due to two years of drought, among other things.
The WPI has been signalling deflation since the October-December 2014 quarter. If that signal was acted upon, the RBI would have started taking strong anti-deflationary measures then. As it stands, the CPI dropped to the levels the RBI considered acceptable only in early 2015. The RBI did start cutting policy rates. But it has done so gradually. Even now, the CPI has shown no signs of going negative (in February 2016, it was running at 5.2 per cent YoY). The decision to target inflation via the CPI has led to better policy. If the RBI had started easing money supply and cutting rates too early and too much, due to using the WPI, it would have caused more inflation.
The RBI targeted pushing CPI inflation below 6 per cent by January 2016. That target has been achieved. The next target is 5 per cent by January 2017. Eventually, the central bank hopes to maintain retail inflation at an averaged 4 per cent from 2016-17, that is, within a band of +/- 2 per cent. If CPI is outside that zone for three consecutive quarters, the RBI will give a comprehensive explanation to the government.
Inflation is also a key variable in the calculation of GDP and it isn't being used logically there. That results in misleading GDP data. GDP growth is always adjusted by using a deflator to remove the effects of inflation. If inflation has been high, the deflator will adjust the high nominal growth downwards. If there has been deflation, the growth will be adjusted upwards.
For example, if nominal GDP grows from 100 to 110, with an inflation rate of 5 per cent, the adjusted real GDP will be calculated as 110/105 × 100 or about 104.77. If GDP has gone from 100 to 110 during a period of deflation, say when inflation was -5 per cent, the adjusted real GDP would be 110/95 × 100 or 115.8.
The deflator used in the calculation of India's GDP is based on an averaged value of the WPI. Since the WPI has been negative since November 2014, the deflator has adjusted real GDP upwards! This, to some extent at least, explains the puzzling high values of GDP in the past two fiscals. The WPI is not a very accurate reflection of the inflation in the services sector. So half the GDP is being adjusted by a misleading index. The deflator used for services should be based on the CPI, which has always been positive. Using a CPI-based deflator would adjust GDP growth down. Government budgeting (and investment flows to some extent) is based on GDP projections to some degree. So there could be problems with the misleading real GDP numbers.
At the very least, inflation data are 'high-speed' in that there are monthly updates. It is also possible for a private institution, or even for individuals, to get a sense of inflation simply by tracking publicly available prices of a basket of common commodities. But no individual would really be capable of checking the official calculations because they involve sampling many prices across many markets. The dangerous aspects of miscalculation of inflation are, of course, the policy errors it induces.
The writer is an independent financial analyst.
This column appeared in the May 2016 Issue of Wealth Insight.
