
The '40 days argument' is often cited as a reason for remaining permanently invested in the equity market. Here's how the logic goes. There are about 230-240 trading days per year. On most sessions, there are small negligible moves in either direction and these small moves largely cancel out.
The broad American index S&P 500 was launched back in 1928. Various stocks have been replaced across this period and there have been times when trading was suspended due to war, etc. But the index has returned about 10 per cent compounded, annualised over the next 89 years!
Most of the gains have come from just 40 critical sessions where there was a big jump. It is naturally impossible to predict in advance when one of those big sessions would occur. So only an investor who was continuously invested would have received the full benefit of those gains.
Don't take these 40 days in 89 years literally. The statistics will differ from market to market and also differ on the basis of how a 'big' move is defined.
But the logic is intuitively appealing. Market returns are normally distributed. This means that most sessions are tightly banded within one or two standard deviations around the mean (average) daily return. There are disproportionate large gains (and losses) only on outlying sessions, which occur rarely. If you miss those rare big sessions, your returns will be mediocre. Timing the market to pick up those big sessions is impossible. Hence, the argument in favour of a continuously-invested strategy.
The concept of passive investments is simple: picking up the index return over a long period is usually enough to beat returns from other assets. In most markets (not in India, however), the passive index return will usually beat active portfolio returns as well.
It may be interesting to see what the Indian situation is with respect to big swing sessions. There could be useful modifications to simply playing markets passively. Even if we can't tell exactly when big sessions will arrive, we may be able to pinpoint when big sessions are more likely.
For example, news-based events can be 'known unknowns'. The budget, elections, central-bank policy reviews, etc., all have an impact on the market and there is always more volatility centred around such events. We don't know in which direction the market will trend but the amplitude of movement is likely to be more when such an event is due.
When more volatility is likely due to some news-based event, the passive long-term investor may be able to take short-term derivative positions to hedge exposure or even use derivatives to pick up a windfall gain if the market trends in a certain direction. For example, a passive investor could buy index puts to hedge for news-based events. If the index falls, option gains could compensate for portfolio loss.
Alternatively, the passive investor might sell index calls if he suspects the market will not rise. If the calls expire without being struck, he keeps the premium.
It's up to the investor to take a call in such situations but the investor who is aware of the historical probability is a little more likely to gain.
Note that there are a few important assumptions in the suggested strategy:
1. The passive investor remains continuously invested throughout via SIPs.
2. The passive investor can take a short-term hedge. This means margin money is available.
3. The passive investor is capable of increasing the commitment to equity under certain conditions.
Consider the Nifty 50 Index. Taking data from January 2010 to the present date, the index has returned just under 8 per cent compounded or about 73 per cent overall. This isn't much. There are periods when the equity market has given far higher returns. Inflation has run close to the equity return for much of this 2010-2017 period.
Losing sessions (where daily change is negative) were less common (851 losing sessions) than winning sessions (937 gaining sessions) in this period. The average loss in a losing session (-0.7767 per cent) is almost exactly the same as the average gain (+0.7761 per cent) in a winning session. The average daily return (all sessions) is 0.03 per cent. The median is 0.04 per cent.
Taking all sessions together, the frequency distribution is very close to the classic normal (see Figure 1). In a classic normal distribution, about 68 per cent of values will stay inside the mean plus/minus one standard deviation. Also, 95 per cent of values will stay within the mean plus/minus two standard deviations. In this set of daily changes, 72 per cent of the values are within one standard deviation, and 94.5 per cent of values are within two standard deviations. So, this is close to a perfect normal distribution.

The outlying sessions are few but some of those outliers can easily be 100x the amplitude of a single 'average' session. An average session sees 0.0362 per cent gain. But there were six sessions in this period which each saw changes of over 100x (+/- 3.62 per cent). As many as 454 sessions, about 25 per cent, saw changes greater than +/- 1.1 per cent. This is 30 times the average change. About 12 per cent (219 sessions) saw downtrends greater than -1.1 per cent.
There is also some tendency to heightened volatility near the budget. An SIP investor might want to hedge Union budgets with deep puts on the February settlement (assuming February 1 as the budget date) to offset possible steep downtrends. If the budget does set off a downtrend, the puts will return profits. General elections also lead to heightened volatility. Again, this event may be worth hedging every five years.
Roughly speaking, a deep put (taken at a strike that is 2 per cent below the money or lower) will cost about 0.5 per cent of the strike price. Once in a while, there's a major fall in index values and the puts could yield a huge return that cushions the passive portfolio against the losses. But most of the time, that premium will be lost. It's hard to say if this strategy could be a gainer over the years.
Another thing is indicated as well. Valuations have risen to the point where there is far more chance of a substantial fall than of a rise.
Figure 2 indicates the percentage of sessions logged at a given P/E range between 2010 and 2017. The P/E is now running at 23.75 and, as the chart indicates, the P/E has risen above 24 just 3.74 per cent of the time. The index is far more likely to correct down than to move up much farther.
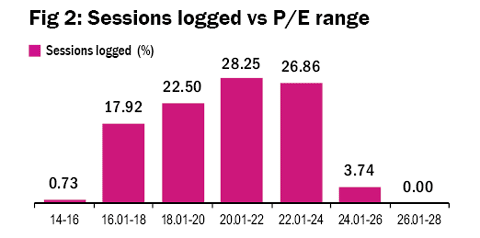
The P/E could correct down while maintaining the current index price levels if earnings grow quickly. Nifty 50's EPS does show some signs of growth, so there's hope. Otherwise, there's quite a good chance that the index will correct.
