
Can BAFs live up to this promise of 'heads, you win; tails, you don't lose'? Let us see what's under the hood of these funds. The first thing that catches the eye is that some dynamic asset allocation funds are not dynamic at all! Based on their historical asset allocation, the balanced advantage schemes of HDFC Mutual Fund and Shriram Mutual Fund have been consistently high on equity and look largely static. Incidentally, HDFC's scheme is the biggest fund in the category, accounting for 27 per cent of the category AUM (as on October 31, 2021). The scheme came into being following the merger of HDFC Prudence Fund (balanced scheme) and HDFC Growth Fund (large-cap scheme) after SEBI's categorisation in 2017. It seems the fund continues to be managed as before despite the change in its investment mandate. See chart 'Misnomers: Funds not true to label'.
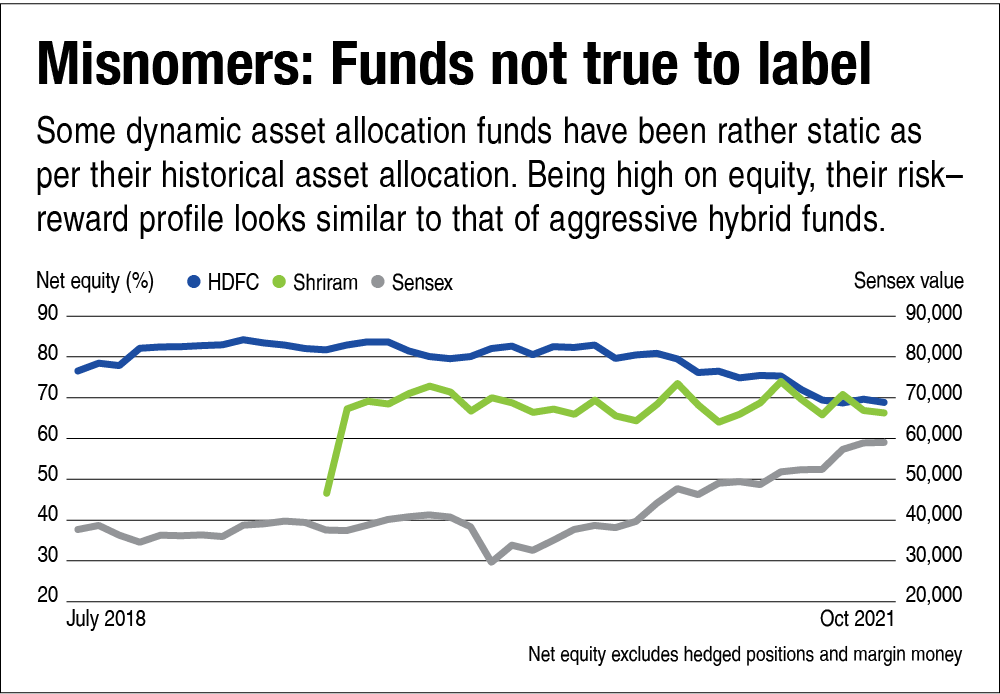
Their risk-reward profile looks similar to aggressive hybrid funds which invest 65-80 per cent in equity. Investors would be better off in an aggressive hybrid fund which is better positioned to live up to their expectations. In the subsequent analyses, we have kept these two funds out of the picture.
However, the remaining 19 funds in the category (excluding five funds with less than a one-year history) are truly dynamic and have altered their asset allocation to a detectable degree at some point or the other. A deeper analysis reveals how different these BAFs are from one another. Due to the high degree of flexibility they have, funds within the same category vacillate widely in their risk-reward profile. In October 2021, the net equity holding (i.e. equity excluding hedged positions) in the BAF category ranged from as low as 2.65 per cent to as high as 61.29 per cent. This huge difference is not limited to one month but across time periods (see graph 'Varying equity allocation'). This also shows that fund houses have vastly different outlooks of the market at any point in time.
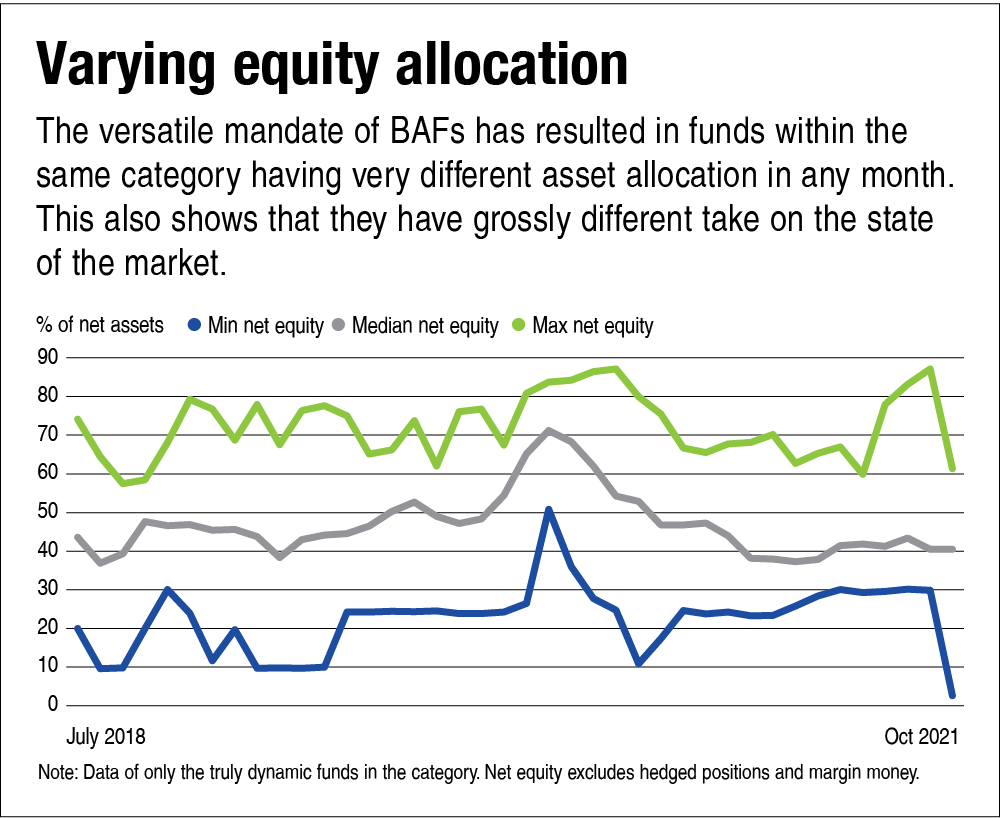
What's also interesting is that barring a few occasions of drastic asset-allocation changes, the net equity holdings of most dynamically managed funds have stayed within a range. They can be categorised into three broad groups based on their median net equity holding - less than 40 per cent, 45-55 per cent and more than 60 per cent, with most of the funds falling in the second category.
This has major implications for investors who are expecting their funds to capture the upside during a bull run and provide downside protection when the bears come out of hibernation. They should know that these funds stack up very differently against each other during different market cycles. Funds with a consistently high allocation to equity will tend to outperform during the up market but will also fall harder during a bear phase. Funds that keep low on equities will protect the downside better but won't be able to match returns when markets are rising.
A single fund cannot consistently take advantage of the up move as well as protect during a crash. The question is, do you need dynamic funds to sail through volatile markets? Can a static 50:50 asset allocation deliver more dependable returns?
Also in this series:
Part 1: Balanced advantage funds: What drives their popularity?
Part 3: Balanced advantage funds: BAFs vs static 50:50 portfolio