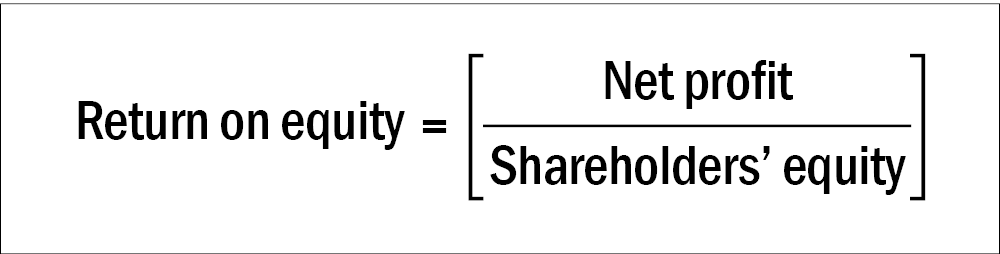
Anyone who has dabbled in the world of equity investing has heard of the metric Return on equity (ROE). It is one of the key efficiency metrics that represent a business's ability to turn shareholder wealth into profits.
It is calculated using the following formula:
For a more detailed description of ROE and how you should use it, click here.
However, it is not without its drawbacks. While useful as an efficiency metric, ROE does not account for debt. A company might be fueling its earnings through high amounts of debt and inflating its ROE, which should always be a red flag for any investor.
In addition, calculating ROE does not provide any insight into how efficiently a company is using its assets to generate earnings.
To overcome these drawbacks, the management of DuPont Corporation proposed an alternative method to estimate a company's ROE in 1912.
Calculating ROE using DuPont analysis
According to the DuPont model, ROE can be represented as a product of three ratios, namely net profit margin, total asset turnover, and financial leverage.

Let's look into what each of these ratios tells us about a company's financial health.
Net profit margin
Net profit margin represents the company's operating efficiency, i.e., how much profit it gets from its revenue. For example, a business might have earned Rs 100 crore in revenue. But if it has to pay 80 crore in operating expenses, interest payments and taxes, it can count only Rs 20 crore as profit.
Net profit margin is calculated using the following formula:

Where net profit is the total income of the company after deducting all the expenses from its revenue.
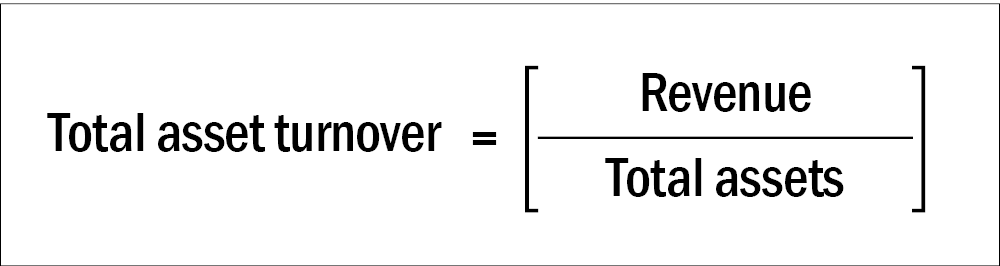
Total asset turnover
Total asset turnover represents the company's efficiency in using its assets or resources to generate revenue. It is calculated using the following formula:
For example, consider two manufacturing companies - A and B. Company A has assets worth Rs 100 crore in the form of manufacturing equipment and generates Rs 40 crore in revenue. On the other hand, Company B has assets worth Rs 100 crore, but it generates Rs 20 crore worth of revenue. It is clear that company A is far more efficient in using its resources and, thus, will have a higher total asset turnover.
Note that the product of the net profit margin and the total asset turnover ratio is called the return on assets, another popular efficiency metric among investors.
Financial leverage
The financial leverage measures how much liability (and debt, in particular) a company has taken. It is calculated using the following formula:

Suppose a company has taken high amounts of debt to buy its assets. In that case, it will have a low shareholders' equity (shareholders' equity is the amount shareholders will get if all of a company's assets are sold and its liabilities are paid) and a high financial leverage.
However, this ratio has a catch. In scenarios where the company has negligible debt but significant other liabilities (such as deferred tax liabilities, accounts payable, etc.), this ratio would still be high. Also, a high accounts payable could indicate high bargaining power over its suppliers, which is a positive. Therefore, investors should pay close attention to the reasons behind a high financial leverage ratio.
Why DuPont analysis is a better way to calculate ROE
From the above definitions, we can rewrite the ROE formula as follows:
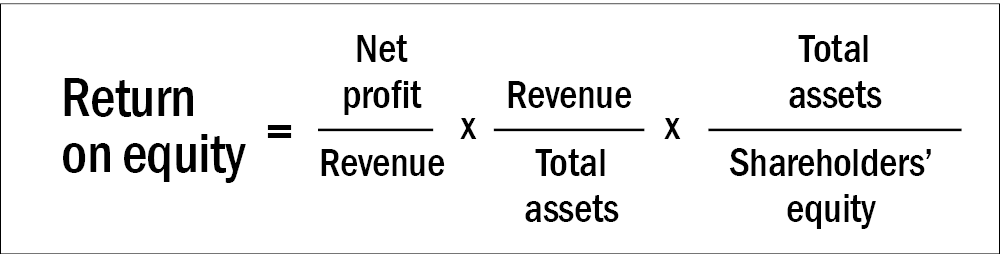
As you can see, simplifying the above equation spits out the original formula for ROE. However, calculating ROE using the DuPont model has the following advantage:
- While calculating the first two ratios, net profit margin and total asset turnover, you can better understand a company's operating efficiency and asset efficiency. If a company has a high amount of interest payments, it will be visible in its net profit margin. Moreover, investors can ascertain if a company is using its assets efficiently from its total asset turnover.
- Some companies have low margins but high asset turnover, and some have high margins but low asset turnover. By breaking the ROE formula into its various factors, you get a better picture of what drives the company's efficiency.
- If a company has used a lot of debt to purchase its assets, it will be visible in the financial leverage ratio. A high financial leverage means a company has used high amounts of debt to purchase its assets.
Suggested read: Don't invest solely based on P/E