The current banking crisis in the US and Europe has got Indian investors rattled. And who can blame them? While semantically different, the current turmoil brings back memories of the infamous Yes Bank crisis.
Don't be alarmed. We are not expecting any bank runs in India.
The Indian banking framework, indeed, is far more robust than its counterparts abroad. However, it has always had a big fat NPA problem.
So, we wanted to check if any omens are lurking around for another Yes Bank-like crisis. But how does one go about it?
Checking the provision coverage ratio (PCR) of banks should be a good starting point. PCR is a gauge of how well a bank is prepared to cover its losses from NPAs. It is calculated as a ratio between the provisions made by the bank against potential loan losses to the total amount of gross non-performing assets (NPAs) the bank has on its books.
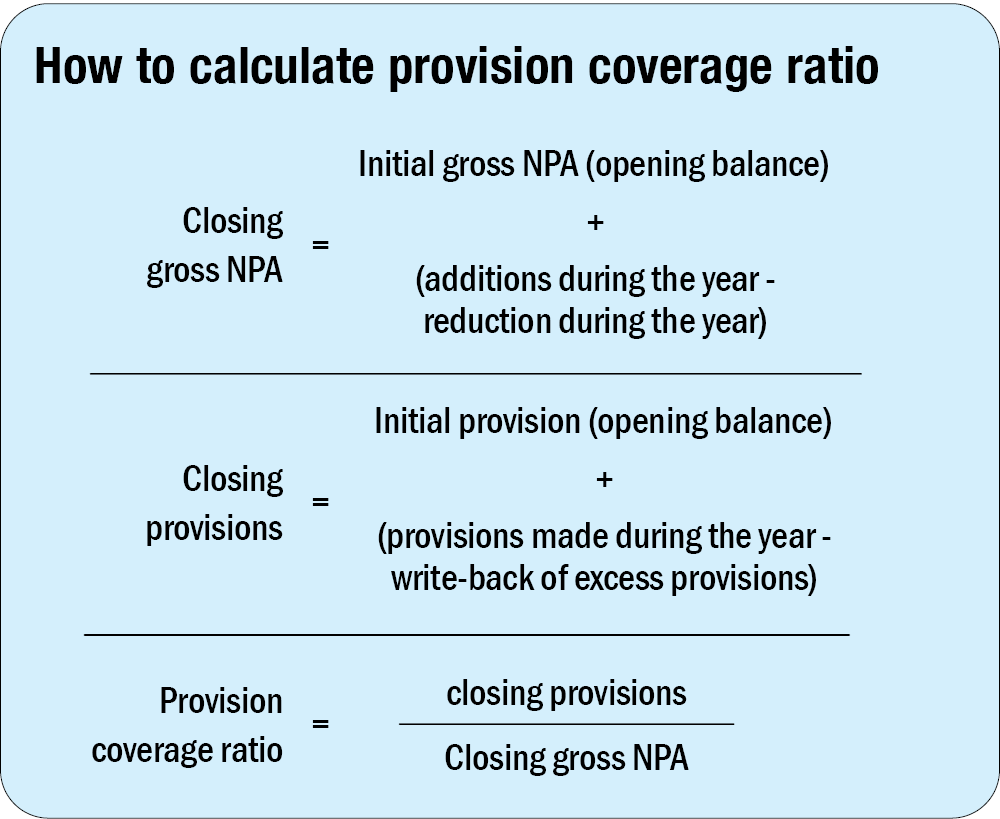
In simple terms, it shows how much money a bank is setting aside in case things go south and it has to cover huge losses from NPAs. So, a high PCR means the bank has set a large chunk of its earnings as a safeguard against potential losses from NPAs.
Why provision coverage ratio can be misleading
Despite PCR being an effective tool to measure a bank's vulnerability to NPAs, it can often be misleading.
This is because what classifies as an NPA is often subjective. As you can see in the formula, there's a write-back of excess provisions involved. However, there are no concrete guidelines regarding the write-back process for provisions. It is mostly dependent on the management's optimism that an NPA will start performing again and provisions are removed based on that. In addition, banks are often guilty of not adding adequate fresh provisions against new NPAs.
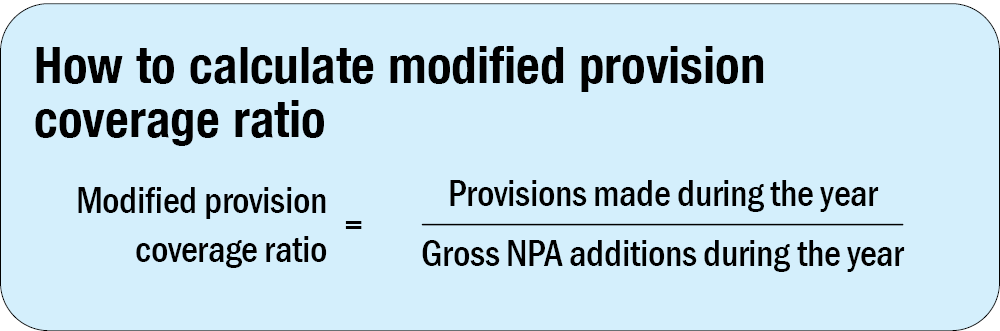
Hence, we decided to modify the PCR to a ratio between the new NPA additions during a year and the amount of fresh provisions made in a year. This modified ratio gives an estimate of how much fresh provisions were made in a year against the new NPAs added in the same year.
We calculated this modified PCR from FY13 to FY22 for two banks with a history of NPA crises, namely Yes Bank and J&K Bank.
Here's what we found.

In the graph for Yes Bank's PCR, you can see the large disparity between the original PCR numbers and our numbers around FY18.
If you recall, this was exactly the financial year that preceded Yes Bank's collapse. This shows how this new approach to provision coverage ratio can be far more helpful when analysing the financial health of banks.

Similarly, in the J&K graph, you can see a wide gap between the PCR numbers stated by the bank in FY13 and FY14 and our modified PCR numbers. Following this period, the bank underwent a period of major crisis.
And at the opposite end of the spectrum, you have HDFC Bank, one of the most stable lenders of the sector. As you can see, there has rarely been a period in the last decade where the bank's PCR numbers had any significant difference from our modified PCR numbers.
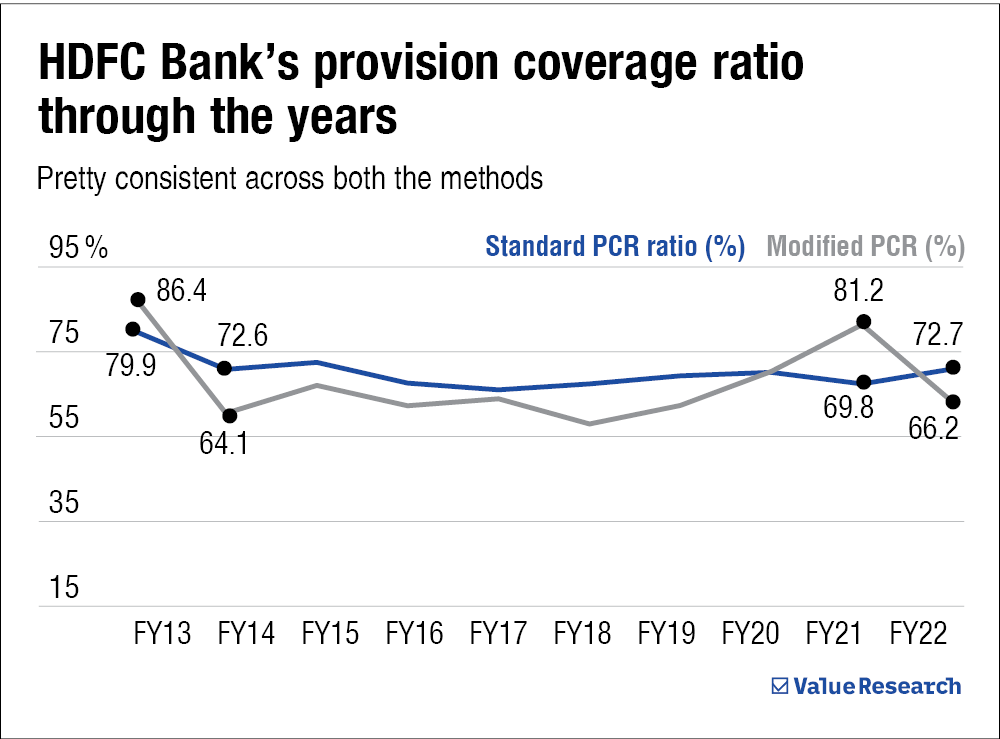
The above shows that this new approach to provision coverage ratio can help investors get a clearer picture of how prepared a bank is against NPA crises.
What you should do
Investors should note that we are not saying that there's any fundamental flaw in how PCR is calculated. However, given how bank's report their NPA numbers, we believe our approach to PCR can assist investors in getting a better understanding of a bank's financial health.
Suggested read: What are price multiples and how to use them?