
Can you currently track all your investments in one place? Or do you use conventional tedious methods like pen and paper, calculators, or Excel sheets?
Introducing 'My Investments' - a comprehensive portfolio manager. An easy-to-use tool that puts all your investments at your fingertips and gives essential insights for you to make informed investment choices.
What's more? You can use it on the go, even on your phone, in just a few clicks!
Why our subscribers are using this tool
1. The 'My Investments' tool provides customised data-driven insights. They tell you if your investments are in good-quality stocks, the nature of your investments, among others. Such insights help you make informed and smart investment decisions.
2. You can easily upload and track all your transactions and investments - mutual funds, stocks, bonds, NPS, PPF, fixed deposits, etc. - in one place.
3. You can analyse your portfolio in various ways.
- How diversified your portfolio is
- The return from each investment
- Their tax liability
- The risk-level of your portfolio.
4. You receive an alert every time a significant market event occurs. For example, change in investment rating, dividends and bonuses, mergers and demergers, etc.
How to use the tool
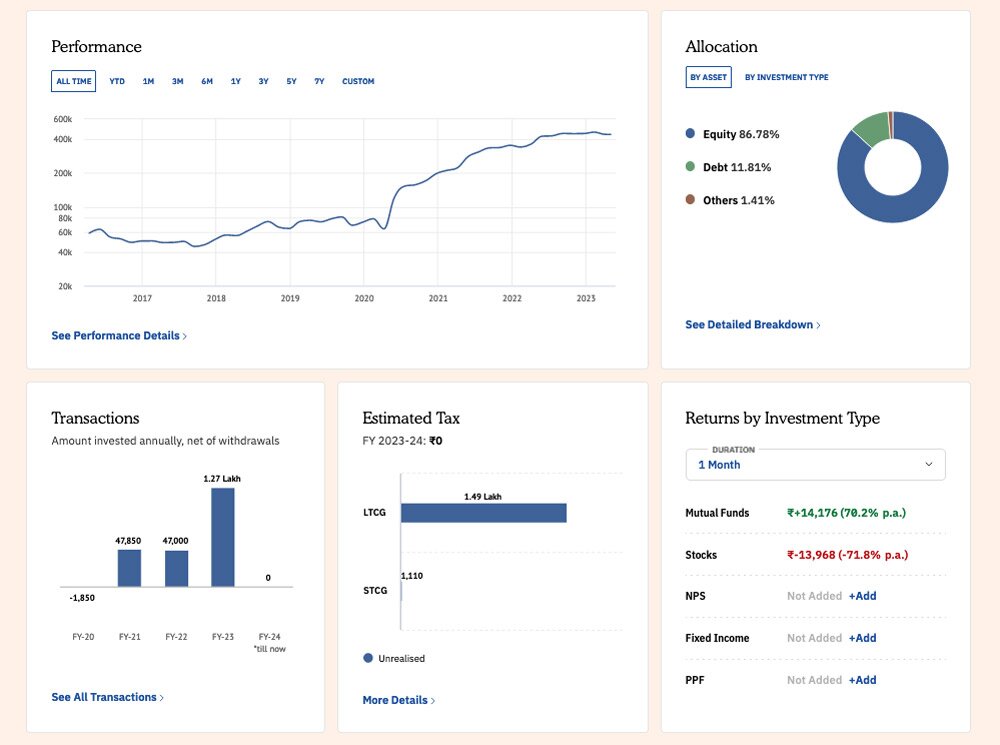
Understanding the 'Dashboard
This tab provides an overview of your investments. It reflects how well your investments are doing, and you can identify problem areas at a glance.
Some of these key insights are:
1. The classification of your investments into stocks, mutual funds, fixed deposits, bonds, and other financial instruments.
2. Key signals related to your performance over time. You can track your aggregate performance across a month, a quarter, a year, or even over custom dates.
3. Your transactions, market gains and losses, estimated tax liability, returns, and our analysis of your portfolio. This page is a crisp graphic overview.
4. These graphs and infographics further take you to different sections, where you can see the details.
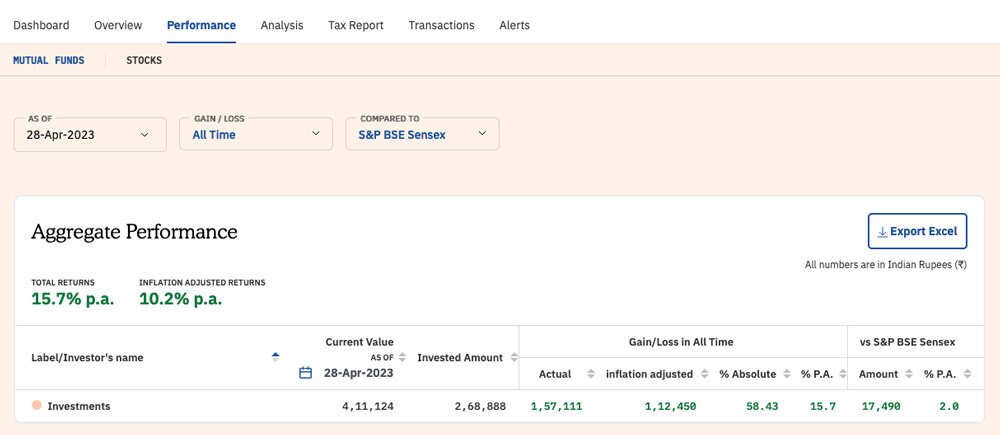
Understanding the 'Performance' tab
This tab shows how your investments are doing. But that's not it.
- You can even compare your portfolio's aggregate and asset-wise performance against market benchmarks using the 'gain/loss' feature on this tab.
In addition to getting the total returns, you can also view:
- the inflation-adjusted returns (which is not easily available)
- whether your investments are beating the Sensex!
(The below screenshot gives you a better understanding of what you'll find in the 'Performance' tab)
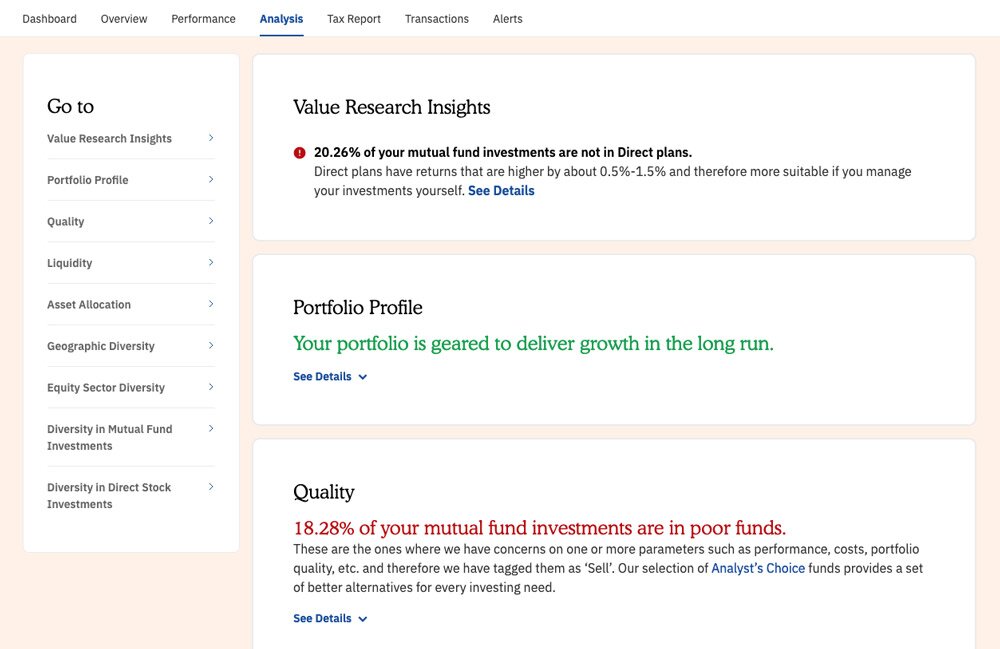
Understanding the 'Analysis' tab
- It rates the quality of your investments.
- It tells you how diversified your investments are (This is important for beginners and advanced investors).
- It gives you the asset allocation of your investments.
- It informs how liquid your investments are.
- You can learn how much risk you're taking and how to avoid it.
- You also receive insights on which holdings you can buy, sell, or avoid!
All these aspects are very important for beginners and advanced investors.
You can get such information for your individual investments too.
Understanding the 'Tax Returns' tab
This section calculates your capital gains tax, and makes your income tax return (ITR) filing hassle-free.
Seasoned investor? There's more for you
1. We understand you prefer a more hands-on approach. So, our Export feature on most data-centric tabs allows you to download your investment-related Excel sheets.
2. If you're interested in keeping a tab on your investments' annual returns, one-day performance, etc., you can see the table in the 'Overview' tab.
3. You can also view performance insights by grouping your investments based on various parameters, such as fund house (AMC), category, rating, etc.
4. Using tax reports, you can download your detailed capital gains statement in the same format as the RTAs (registrar and transfer agents) provide. Additionally, you can rebalance your portfolio or exit funds based on the tax report.
5. Need a second opinion? Share your portfolio with your financial advisor or family. Go to the 'Overview' tab and 'Export' your portfolio in an Excel spreadsheet.
They say the proof of the pudding is in the eating, which is why we encourage you to use our My Investments universe.
We promise to simplify and change your investment management experience forever.
Note - Certain features are available only to Value Research Premium members. However, the free version of the tool still offers valuable information that is hard to acquire elsewhere. We encourage you to use the tool for a seamless portfolio management experience.
